All content on this site is intended for healthcare professionals only. By acknowledging this message and accessing the information on this website you are confirming that you are a healthcare professional. If you are a patient or carer, please visit the MDS Alliance.
The MDS Hub website uses a third-party service provided by Google that dynamically translates web content. Translations are machine generated, so may not be an exact or complete translation, and the MDS Hub cannot guarantee the accuracy of translated content. The MDS Hub and its employees will not be liable for any direct, indirect, or consequential damages (even if foreseeable) resulting from use of the Google Translate feature. For further support with Google Translate, visit Google Translate Help.


Now you can support HCPs in making informed decisions for their patients
Your contribution helps us continuously deliver expertly curated content to HCPs worldwide. You will also have the opportunity to make a content suggestion for consideration and receive updates on the impact contributions are making to our content.
Find out more
Create an account to access:
Bookmark & personalize site content
Receive alerts for new content in your areas of interest
View MDS content recommended for you
The utility of targeted exon sequencing in the diagnosis of MDS in people with cytopenia
Accurate diagnosis of myelodysplastic syndromes (MDS) is important to spare patients without a myeloid malignancy from treatment with potentially harmful agents and to differentiate between MDS and other myeloid malignancies, ensuring appropriate treatment is provided.1 Also, a number of factors can contribute to peripheral blood cytopenia, which can make the diagnosis of MDS challenging.1 The National MDS Natural History Study (NCT02775383) is a prospective initiative, previously reported by the MDS Hub, enrolling patients with cytopenia to be evaluated for MDS using two independent histopathologic reviews.
Next-generation sequencing may help to improve the diagnosis and prognostication of patients with MDS by allowing for the simultaneous sequencing of multiple MDS-associated genes. Here, we summarize key results from the National MDS Natural History Study, recently published by DeZern et al.1 in Blood Advances, which aimed to investigate the clinical utility of targeted exon sequencing of bone marrow-derived DNA, associated single nucleotide variants, and small insertions and deletions in 53 genes for the diagnosis of patients who may have myeloid malignancies, including MDS. The study also sought to determine the importance of variant allele frequency (VAF) versus binary mutational profiles with regard to classifier performance.
Study design and patient characteristics
Samples from patients with untreated cytopenia were classified as either myeloid malignancy or not, with myeloid malignancies further classified as MDS or non-MDS by local and central pathologists. Any disagreements regarding classifications were settled by a tertiary reviewer. In the study, 96 genes were sequenced using targeted exon sequencing, of which 53 were manually reviewed and included in the analysis if they were likely disease-causing variants. Both a binary indicator variable of each gene that indicated ≥1 mutation and the maximum VAF across one or more mutations for each gene were included in the two-stage diagnostic classifier.
The two-stage diagnostic classifier consists of an “outer” model which predicts myeloid malignancy or not, and a conditional “inner” model which predicts MDS or not in patients believed to have a myeloid malignancy.
In total, 1,298 patients were included in this analysis, of which 39% had a diagnosis of myeloid malignancy. Of the patients with myeloid malignancies, 67% were classified as having MDS.
Key points
Genetic characteristics
Across the entire study cohort, 61% of patients had ≥1 variant detected in 46 of the 53 manually reviewed genes (Figure 1).
Figure 1. Percentage of patients with ≥1 variant detected in 46 of the 53 manually reviewed genes*
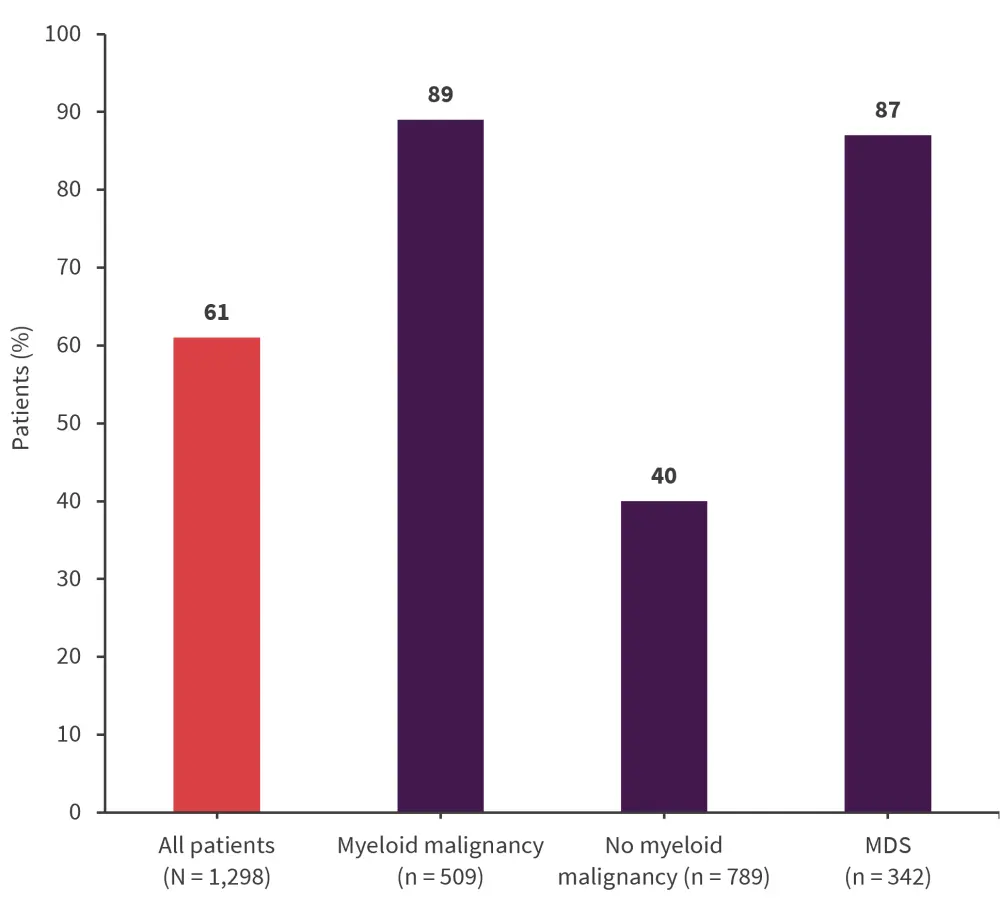
MDS, myelodysplastic syndromes.
*Data from DeZern, et al.1
The ten most commonly mutated genes in the myeloid malignancy and MDS groups are shown in Figures 2 and Figure 3, respectively.
Figure 2. Ten most commonly mutated genes in the myeloid malignancy group (n = 509)*
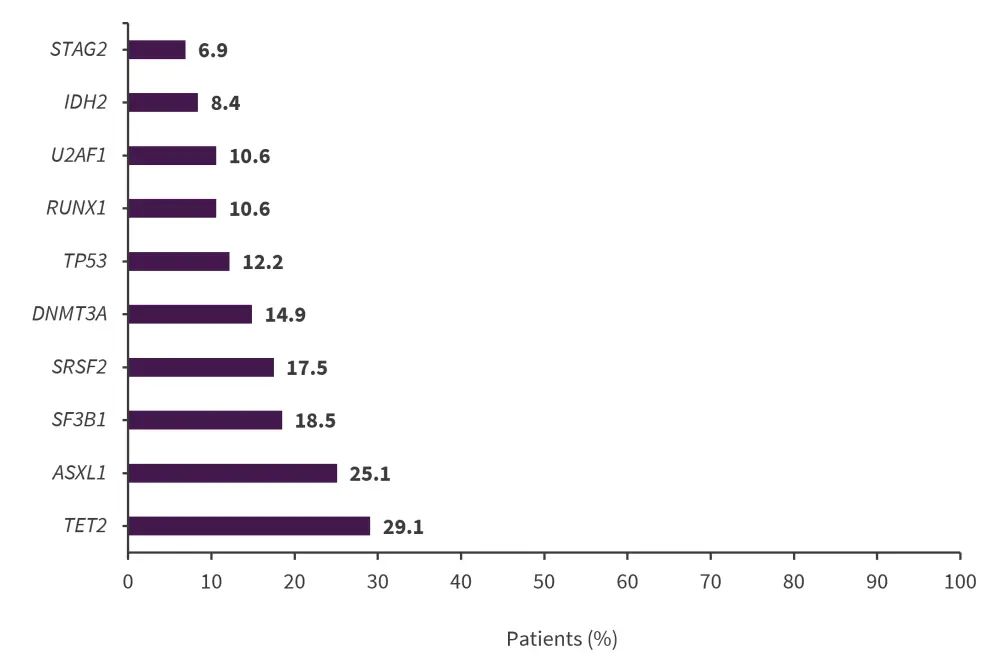
*Data from DeZern, et al.1
Figure 3. Ten most commonly mutated genes in the MDS group (n = 342)*
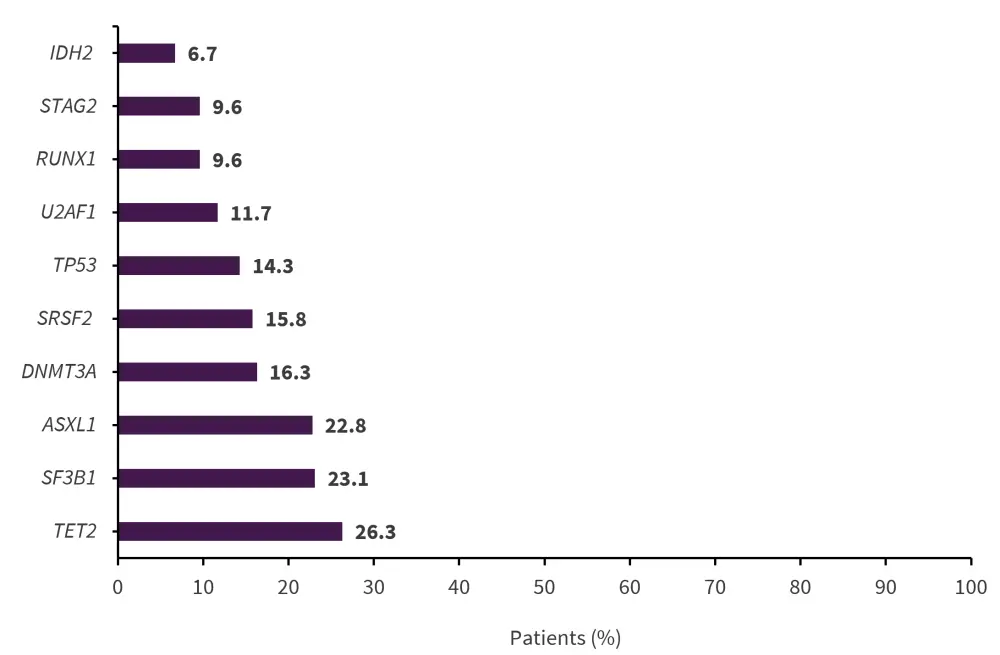
*Data from DeZern, et al.1
Two-stage diagnostic classifier
Bootstrap resampling was used to assess the performance of the diagnostic classifier using the VAF and binary mutational profile-based models (Table 1). Median receiver operating characteristic (ROC) analysis, a graphical representation of the sensitivity (true positive rate) plotted against the specificity (false positive rate) for a range of threshold values, was used to determine the consistency and generalizability of the diagnostic accuracy of the models. The area under the ROC curve (AUROC) was used to measure the overall diagnostic accuracy of the models.
Table 1. Performance metrics for the two-stage diagnostic classifier based on maximum VAF and binary mutational profiles*
|
AUROC, are under the receiver operating characteristic curve; BIN, input matrix based on 0 and 1 encoding any variant presence/absence in a gene; MDS, myelodysplastic syndromes; NPV, negative predictive value; PPV, positive predictive value; VAF, input matrix based on maximum variant allele frequency. |
||||
|
Metric, median |
Outer model |
Inner model |
||
|---|---|---|---|---|
|
VAF (17 genes) |
BIN (17 genes) |
VAF (10 genes) |
BIN (7 genes) |
|
|
Sensitivity |
0.66 |
0.65 |
0.70 |
0.73 |
|
Specificity |
0.92 |
0.91 |
0.66 |
0.58 |
|
Accuracy |
0.81 |
0.81 |
0.67 |
0.66 |
|
PPV |
0.84 |
0.82 |
0.71 |
0.68 |
|
NPV |
0.80 |
0.80 |
0.64 |
0.63 |
|
F0.5 score |
0.79 |
0.78 |
0.70 |
0.69 |
|
AUROC |
0.85 |
0.85 |
0.73 |
0.69 |
|
Percent selection |
1.00 |
1.00 |
0.68 |
0.69 |
- The VAF-based model elicited improved performance over the binary mutational profile-based model when predicting MDS versus non-MDS myeloid malignancy. This was demonstrated by an upward shift in the median ROC with a higher AUROC (0.73 vs 0.69) and a narrower 95% bootstrap confidence band.
- When predicting myeloid malignancy versus no myeloid malignancy, the VAF-based model had slightly narrower 95% bootstrap confidence bands for the ROC than the binary mutational profile-based model; however, the AUROC was similar in both models (0.85).
- In the VAF-based model, 17 genes were necessary to diagnose a patient with a myeloid malignancy or not.
- The 17 genes for which a higher VAF was associated with a diagnosis of myeloid malignancy were: SF3B1, TP53, ASXL1, U2AF1, JAK2, NPM1, DDX41, STAG2, RUNX1, SRSF2, IDH2, PHF6, TET2, DNMT3A, BCOR, IDH1, and ZRSR2.
- The top 14 genes (excluding BCOR, IDH1, and ZRSR2) had a ≥95% selection frequency among the 1,000 bootstrap samples, indicating that these genes have a strong association with a myeloid malignancy diagnosis.
- Ten genes were sufficient to classify a myeloid malignancy as either MDS or a non-MDS myeloid malignancy: JAK2, STAG2, SF3B1, TET2, TP53, ASXL1, SRSF2, PHF6, IDH2, and CBL.
- JAK2, STAG2, SF3B1, and TET2 had a ≥95% selection frequency among bootstrap samples.
- A higher VAF in STAG2, SF3B1, and TP53 genes was associated with an MDS diagnosis, while a higher VAF in JAK2, TET2, ASXL1, SRSF2, PHF6, IDH2, and CBL were associated with non-MDS myeloid malignancies.
Predictive value of the two-stage diagnostic classifier
- The two-stage conditional model was validated using the samples that had concurring local and central pathology diagnoses without dispute by a third pathology diagnosis.
- The model was then used to predict a diagnosis for the 139 patient samples for which there were disagreements on the diagnosis of myeloid malignancy versus no myeloid malignancy.
- The model accurately assigned 71% of patients to the same diagnosis as the tertiary reviewer based on 16 predictive genes, including 56% of patients with a myeloid malignancy (positive predictive value, 0.83) and 88% without a myeloid malignancy (negative predictive value, 0.65).
- The model was also used on the 25 patients for which there were discrepancies in the classification of MDS versus non-MDS myeloid malignancy.
- In total, 76% were classified as having a myeloid malignancy and of these patients, based on 7 predictive genes, 58% were accurately assigned a diagnosis of MDS in agreement with the tertiary reviewer. This included 57% of patients with MDS who were classified as having a non-MDS myeloid malignancy (positive predictive value, 0.44) and 58% of patients with non-MDS myeloid malignancies who were misclassified as MDS (negative predictive value, 0.70).
- Importantly, the accuracy of diagnosis by morphology alone by the two reviewers was 89%, but when using the two-stage conditional model to resolve any disagreement in diagnoses, the accuracy increased to 97%.
Conclusion
This two-stage diagnostic classifier could help improve diagnostic accuracy in myeloid malignancies and refine the classification of myeloid malignancies as MDS or other. The model performed better when distinguishing between myeloid malignancies and non-myeloid malignancies over discerning MDS from non-MDS. This could be due to the overlap in mutations present in patients with MDS and other myeloid malignancies, such as acute myeloid leukemia and MDS/myeloproliferative neoplasm. This study also included 316 patients with clonal cytopenia of unknown significance which can be difficult to distinguish from patients with MDS and likely affected the performance of the model; however, this is reflective of real-world populations. The VAF-based model showed improved performance over the binary mutational profile-based model when classifying myeloid malignancies as either MDS or non-MDS, demonstrating the clinical relevance of VAF when diagnosing patients with MDS; however, binary mutational profiles alone may be sufficient when discerning between myeloid malignancies or no myeloid malignancies.
This study was limited by the 53 genes included in the analysis, as clinically relevant genes could exist beyond this list; the study also did not evaluate cytogenetic influencers. Despite these limitations, the two-stage diagnostic classifier may represent a useful tool for clinicians and could provide reassurance when diagnosing difficult cases in the future. Further studies to improve this model could incorporate more genes, the karyotype, and other clinically relevant information to further improve its robustness. An online version of the two-stage diagnostic classifier is available at https://thenationalmdsstudy.net/.
References
Please indicate your level of agreement with the following statements:
The content was clear and easy to understand
The content addressed the learning objectives
The content was relevant to my practice
I will change my clinical practice as a result of this content
