All content on this site is intended for healthcare professionals only. By acknowledging this message and accessing the information on this website you are confirming that you are a healthcare professional. If you are a patient or carer, please visit the MDS Alliance.
The MDS Hub website uses a third-party service provided by Google that dynamically translates web content. Translations are machine generated, so may not be an exact or complete translation, and the MDS Hub cannot guarantee the accuracy of translated content. The MDS Hub and its employees will not be liable for any direct, indirect, or consequential damages (even if foreseeable) resulting from use of the Google Translate feature. For further support with Google Translate, visit Google Translate Help.


Now you can support HCPs in making informed decisions for their patients
Your contribution helps us continuously deliver expertly curated content to HCPs worldwide. You will also have the opportunity to make a content suggestion for consideration and receive updates on the impact contributions are making to our content.
Find out more
Create an account to access:
Bookmark & personalize site content
Receive alerts for new content in your areas of interest
View MDS content recommended for you
Characterizing the genetic landscape of patients with myelodysplastic / myeloproliferative neoplasms
Making a differential diagnosis for subtypes of myelodysplastic/myeloproliferative neoplasms (MDS/MPN) remains challenging due to overlapping features between these disorders. More than 90% of patients have somatic mutations in known genes that influence the pathophysiology and contribute to the clinical heterogeneity of MDS/MPN, but these mutations are not disease specific. Accordingly, molecular data is not incorporated into diagnostic criteria for MDS/MPN.
Here, we summarize the results of a genome-wide sequencing analysis performed by Laura Palamo and colleagues to characterize the genetic landscape in patients with MDS/MPN.1 In this study, the authors sought to better understand the relationship between the molecular profile and phenotypic characteristics of specific MDS/MPN subtypes and identify potential diagnostic and prognostic molecular markers to help in clinical decision making.
Study design
The study cohort comprised 367 adult patients with MDS/MPN, diagnosed with the following subtypes, according to the 2017 World Health Organisation (WHO) classification:2
- Chronic myelomonocytic leukemia (CMML; n = 119)
- Atypical chronic myeloid leukemia (aCML; n = 71)
- MDS/MPN with ring sideroblasts and thrombocytosis (MDS/MPN-RS-T; n = 71)
- MDS/MPN unclassifiable (MDS/MPN-U; n = 106)
Clinical and molecular data were obtained from bone marrow and peripheral blood samples collected during diagnostic work-up. Routine analyses included cytomorphology, chromosome banding analysis (CBA), and standard molecular assessments.
DNA samples were obtained retrospectively, either at diagnosis or from treatment-naïve patients, for either whole-genome sequencing (WGS; n = 349) or whole-exome sequencing (WES; n = 18). The main study limitation was a lack of control paired samples for comparison. Because of this, tumor-unmatched variant calling was performed using a pool of sex-matched DNA, and the analysis focused on the frequency of recurrent mutations, which have a greater likelihood of clinical relevance.
Relationships between clonal and subclonal DNA variants were evaluated using variant allele frequency (VAF) estimates in each sample, followed by variant filtering. A difference between VAFs of > 5% distinguished ancestral/dominant mutations from secondary subclonal hits. Mutations with a difference of < 5% were defined as codominant.
Key results
Selected demographic, hematological, and clinical data for the patient cohort is summarized in Table 1.
Table 1. Selected demographic, hematological, and clinical data1
|
aCML, atypical chronic myeloid leukemia; BM, bone marrow; CMML, chronic myelomonocytic leukemia; del, deletion; Hb, hemoglobin; MDS, myelodysplastic syndromes; MPN, myeloproliferative neoplasms; MDS/MPN-RS-T; MDS/MPN with ring sideroblasts and thrombocytosis; MDS/MPN-U; MDS/MPN unclassifiable; WBC, white blood cell. |
||||
|
Characteristic |
CMML |
aCML |
MDS/MPN-RS-T |
MDS/MPN-U |
|---|---|---|---|---|
|
Sex, male, % |
66 |
70 |
38 |
63 |
|
Median age, years |
77 |
74 |
74 |
75 |
|
Blood counts, median |
|
|
|
|
|
< 5% BM blasts, % |
68 |
76 |
96 |
72 |
|
BM ring sideroblasts, median (range) |
0 (0–18) |
0 (0–14) |
66 (18–97) |
0 (0–84) |
|
Cytogenetics, % |
|
|
|
|
Frequency of chromosomal abnormalities and gene mutations
CBA revealed an abnormal karyotype in 29% of patients with available data (n = 359); the most frequent abnormalities were +8 (12%), -7/del(7q) (5%), and -Y (3%) (Table 1). With altered karyotypes in 42% and 47% of cases, respectively, aCML and MDS/MPN-U subtypes showed higher genomic instability than CMML (17%) or MDS/MPN-RS-T (10%) subtypes.
A total of 20,304 DNA variants were identified in the MDS/MPN cohort. The mean number of DNA variants per patient was lower for MDS/MPN-RS-T, compared with other subtypes (48 in MDS/MPN-RS-T vs 55 in CMML, 58 in MDS/MPN-U, and 60 in aCML; p < 0.001).
Overall, 30 gene mutations were recurring in ≥ 3% of the patient cohort, all of which have been previously reported in myeloid neoplasms. The most common are shown in Figure 1.
Figure 1. Frequency of common recurrent gene mutations in patients with MDS/MPN1
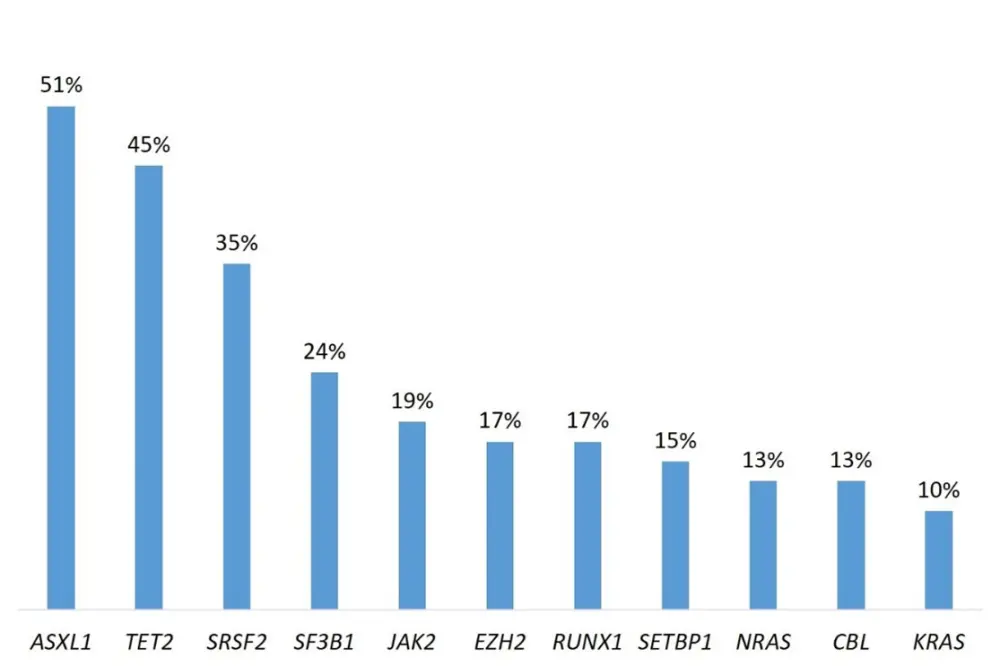
It is noteworthy that, with 91% concordance, there was strong agreement between the recurrent gains and losses detected by copy number variation using WGS data and those detected by CBA.
Genotype-phenotype correlations
The authors found several significant associations between recurrent gene mutations and chromosome abnormalities, as well as hematological and clinical features, which differed amongst MDS/MPN subtypes. The strongest positive associations between specific gene mutations and MDS/MPN subtype were:
- MDS/MPN-RS-T with SF3B1 and JAK2,
- aCML with ASXL1 and SETBP1,
- CMML with TET2, SRSF2, and KRAS, and
- MDS/MPN-U with TP53 and U2AF1.
Of clinical relevance, SF3B1 was strongly associated with ring sideroblasts, and there was an association between both SF3B1 and JAK2 and thrombocytosis. ASXL1 was associated with leukocytosis, and TET2 was associated with BM blasts > 10%.
Subtype-specific clonal architecture
Overall, the acquisition of mutations in MDS/MPN appeared to be similar to that reported for other neoplasms. High VAFs for epigenetic regulators (DNMT3A, TET2, and ASXL1) and splicing factors (SF3B1 and SRSF2) inferred that they were major driver events, whereas secondary mutations were observed for genes involved in signaling pathways (JAK2, N/KRAS, CBL, and ETNK1). However, the mutational profile and clonal architecture differed across subtypes, for example:
- Patients with CMML had frequent ancestral mutations in TET2 (71%), SRSF2 (55%), and ASXL1 (49%).
- aCML was characterized by frequent mutations in ASXL1 (92%; p < 0.0001), which were most commonly ancestral (79%), and was strongly associated with SETBP1 mutations (38%; p < 0.0001), which were codominant or secondary to mutations in ASXL1.
- Patients with MDS/MPN-RS-T had the most frequent mutations in SF3B1 (97%); the mutation was ancestral in 94% of cases. No mutations in Ras/MAPK pathway genes were found in these patients.
- Of all the subtypes, patients with MDS/MPN-U had the highest frequency of TP53 mutations (12%; p = 0.0003).
Molecular signatures
Given the subtype-specific associations observed between some gene mutations and phenotypic features, the authors postulated that mutations in certain gene combinations may aid differential diagnosis of MDS/MPN subtypes. Although some gene mutations were equally common across subtypes, specific gene combinations were associated with distinct subtypes, for example:
- SRSF2 in combination with TET2 was associated with CMML, whereas an SRSF2-SETBP1 combination correlated with aCML.
- RUNX1 in combination with SRSF2 was associated with CMML, whereas a RUNX1-EZH2 combination was a significant occurrence in aCML.
- SF3B1-JAK2 and SF3B1-DNMT3A combinations were associated with MDS/MPN-RS-T.
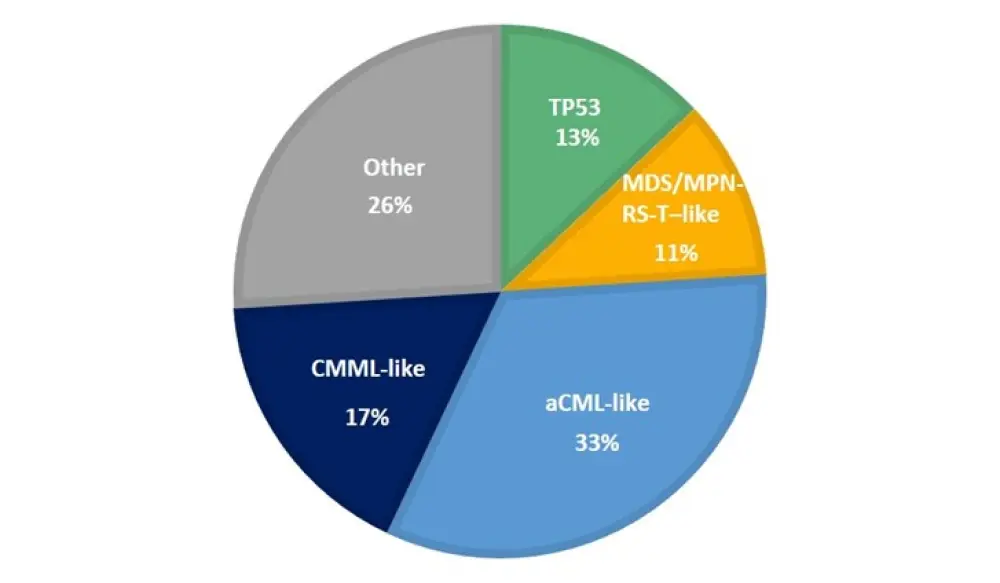
The molecular profile of patients with MDS/MPN-U was heterogeneous, and often mimicked the other subtypes. Therefore, the authors sought to further subclassify these patients based on the presence of specific gene combinations. Patients with MDS/MPN-U were classified into 5 subgroups: CMML-like, aCML-like, MDS/MPN-RS-T–like, TP53, and Other (Figure 2).
Figure 2. The proportion of patients with MDS/MPN-U subtypes, categorized according to molecular profile1
Survival analysis
Table 2 shows the overall survival (OS) data according to MDS/MPN subtype. The most inferior OS is observed for aCML, a subtype known to have a particularly aggressive course. In the univariate analysis of OS, the following observations were noteworthy:
- Cytogenetic abnormalities were associated with inferior outcome in all subtypes, except aCML, particularly for patients with MDS/MPN-RS-T.
- Mutations in ASXL1 were consistently associated with a poor prognosis in all subtypes, except aCML.
- In aCML, mutations in SRSF2 and SETBP1 were associated with an improved outcome, whereas RUNX1, NRAS, and CUX1 mutations conferred a poor prognosis.
- In CMML, an inferior outcome was correlated with ASXL1 and RUNX1 mutations (included in the molecular prognostic system for CMML), and the less common STAG2 and U2AF1 mutations.
- The only mutations to confer poor prognosis in MDS/MPN-RS-T were ASXL1, and EZH2.
- In MDS/MPN-U, the molecular classification proposed in this study had the strongest prognostic impact; higher risk was associated with aCML-like and P53 subtypes.
Table 2. Outcome data according to subtype for patients with MDS/MPN1
|
Outcome |
CMML |
aCML |
MDS/MPN-RS-T |
MDS/MPN-U |
|---|---|---|---|---|
|
Cases with follow-up, % |
83 |
79 |
73 |
69 |
|
Median follow-up, months (range) |
39 (2–112) |
12 (3–98) |
48 (2–163) |
21 (2–182) |
|
Leukemic transformation, % |
18 |
9 |
9 |
10 |
|
Median OS, months (95% CI) |
74 (48-101) |
16 (12–20) |
NR |
80 (NR) |
|
aCML, atypical chronic myeloid leukemia; CI, confidence interval; CMML, chronic myelomonocytic leukemia; MDS, myelodysplastic syndromes; MPN, myeloproliferative neoplasms; MDS/MPN-RS-T; MDS/MPN with ring sideroblasts and thrombocytosis; MDS/MPN-U; MDS/MPN unclassifiable; NR, not reached; OS, overall survival. |
||||
Conclusions
This mutational analysis of a large, well-defined population of patients with MDS/MPN has helped provide insight into the clonal architecture of these disorders. Associations were found between certain combinations of gene mutations and specific disease subtypes, and patients with MDS/MPN-U had heterogeneous molecular profiles that mimicked other subtypes. The molecular differences may aid the diagnostic workup and assessment of prognostic impact in patients with MDS/MPN, and the authors recommend performing targeted sequencing analysis for patients with MDS/MPN-U as well as for patients with an unclear diagnosis. In addition, the presented data may support treatment decisions that involve targeted therapies.
References
Please indicate your level of agreement with the following statements:
The content was clear and easy to understand
The content addressed the learning objectives
The content was relevant to my practice
I will change my clinical practice as a result of this content