All content on this site is intended for healthcare professionals only. By acknowledging this message and accessing the information on this website you are confirming that you are a Healthcare Professional. If you are a patient or carer, please visit the MDS Alliance.
The mds Hub website uses a third-party service provided by Google that dynamically translates web content. Translations are machine generated, so may not be an exact or complete translation, and the mds Hub cannot guarantee the accuracy of translated content. The mds and its employees will not be liable for any direct, indirect, or consequential damages (even if foreseeable) resulting from use of the Google Translate feature. For further support with Google Translate, visit Google Translate Help.
Now you can support HCPs in making informed decisions for their patients
Your contribution helps us continuously deliver expertly curated content to HCPs worldwide. You will also have the opportunity to make a content suggestion for consideration and receive updates on the impact contributions are making to our content.
Find out more
Create an account and access these new features:
Bookmark content to read later
Select your specific areas of interest
View MDS content recommended for you
Monitoring iron overload disorder in MDS
Many patients with myelodysplastic syndromes (MDS) require regular red blood cell (RBC) transfusions to alleviate anemia-related symptoms as part of their supportive care.1 Ineffective erythropoiesis results in the dysregulation of iron metabolism. Additionally, dependence on RBC transfusions can result in patients being unable to excrete the excess iron transfused, leading to iron overload.1 While transfusion dependence is an independent negative prognostic factor, the resulting iron overload may also result in damage to DNA, cells, and organs due to oxidative stress.1,2
Plasma ferritin levels are assessed in order to monitor iron overload, with ferritin levels >1,000 μg/L indicating iron overload.1 Once these levels are reached, and the patient has received >20 RBC transfusions or is transfusion dependent, international guidelines recommend initiating iron chelation therapy (ICT) to remove excess iron from the body.1 However, ferritin level assessment may be distorted by underlying inflammation and no longer correlate with iron availability. Monitoring transferrin saturation (TSAT) may give a better correlation with clinical outcomes in patients with MDS, but this has not been well studied.2
As part of our editorial theme on supportive care in MDS, we summarize two recently published articles by Rozema et al.1 in the European Journal of Haematology and by Teichman et al.2 in Haematologica, which discuss iron overload disorder in patients with MDS.
Monitoring ferritin levels – Rozema et al.1
Methods
This study contained a retrospective cohort of 237 patients with MDS who received at least one RBC transfusion between 2005 and 2019 in Friesland, the Netherlands, from the HemoBase registry. Plasma ferritin was measured using a chemistry analyzer immunoassay. The revised International Prognostic Scoring System (IPSS-R) score, Charlson Comorbidity Index (CCI) score, and patient age were assessed to determine their contribution to plasma ferritin monitoring. Guideline adherence for initiating ICT was analyzed by comparing the prescription of ICT to national guidelines. The relative risks (RR) of monitoring plasma ferritin levels for different patient characteristics were analyzed using logistic regression analyses.
Results
Patient characteristics
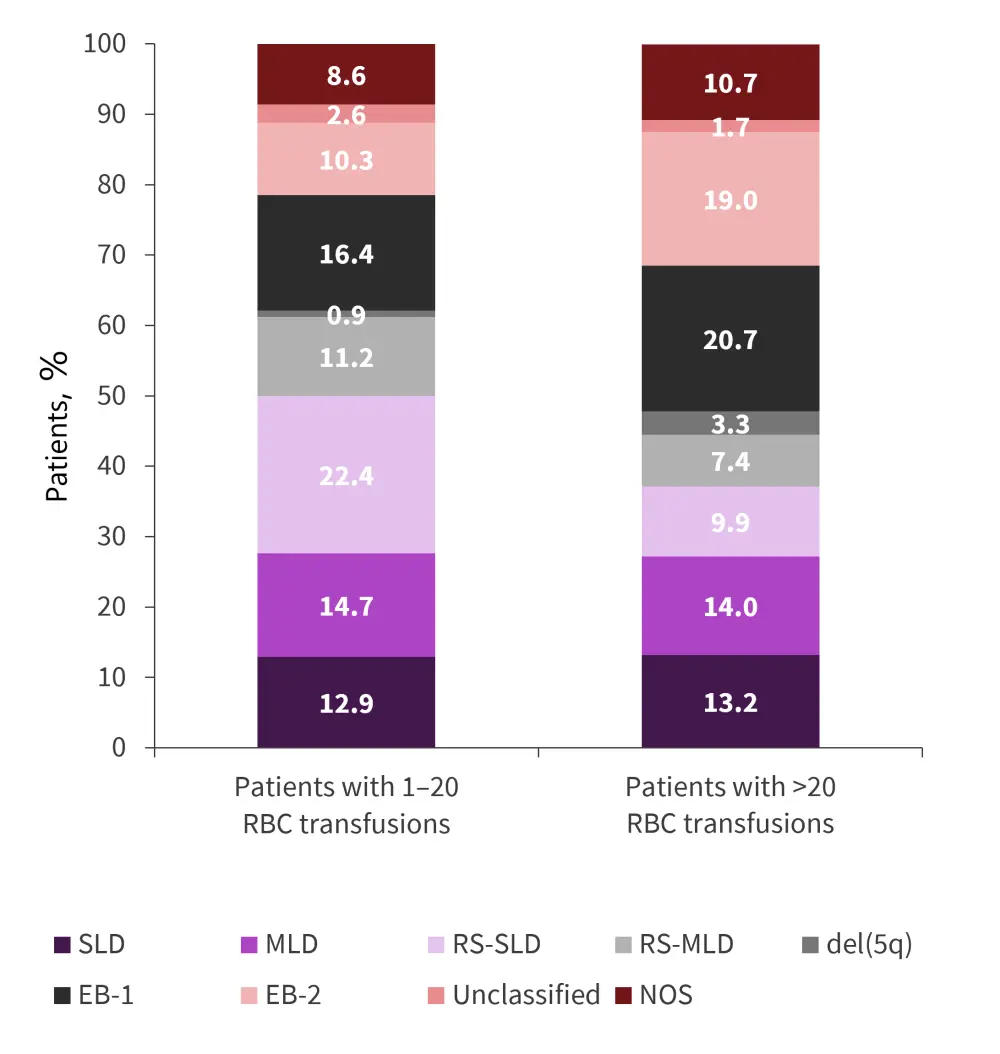
Among the 237 patients identified, 69.2% were male with a median age of 76.0 years (Table 1). The median follow-up time for patients who received 1–20 RBC transfusions and >20 RBC transfusions was 18.2 months and 23.8 months, respectively. Patients were also categorized by MDS subtype (Figure 1).
Table 1. Patient characteristics*
|
CCI, Charlson Comorbidity Index; ICT, iron chelation therapy; IPSS-R, revised International Prognostic Scoring System; RBC, red blood cell. |
||
|
Characteristic, % unless otherwise specified |
Patients with 1–20 RBC transfusions |
Patients with >20 RBC transfusions |
|---|---|---|
|
Sex |
|
|
|
Male |
64.7 |
73.6 |
|
Median age at diagnosis, years (range) |
75.9 (36.8–92.0) |
76.2 (27.5–91.7) |
|
IPSS-R |
|
|
|
Very low |
8.6 |
5.8 |
|
Low |
29.3 |
27.3 |
|
Intermediate |
16.4 |
12.4 |
|
High |
4.3 |
11.6 |
|
Very high |
5.2 |
7.4 |
|
Unknown |
36.2 |
35.5 |
|
CCI score |
|
|
|
0 |
24.1 |
35.5 |
|
1 |
23.3 |
16.5 |
|
2–3 |
20.7 |
27.3 |
|
≥4 |
29.3 |
20.7 |
|
Unknown |
2.6 |
0 |
|
ICT |
6.0 |
19.0 |
Figure 1. MDS subtype by treatment received*

del(5q), deletion in the long arm of Chromosome 5; EB, excess blasts; MDS, myelodysplastic syndromes; MLD, multilineage dysplasia; NOS, not otherwise specified; RBC, red blood cell; RS, ring sideroblasts; SLD, single lineage dysplasia.
*Data from Rozema, et al.1
Plasma ferritin monitoring
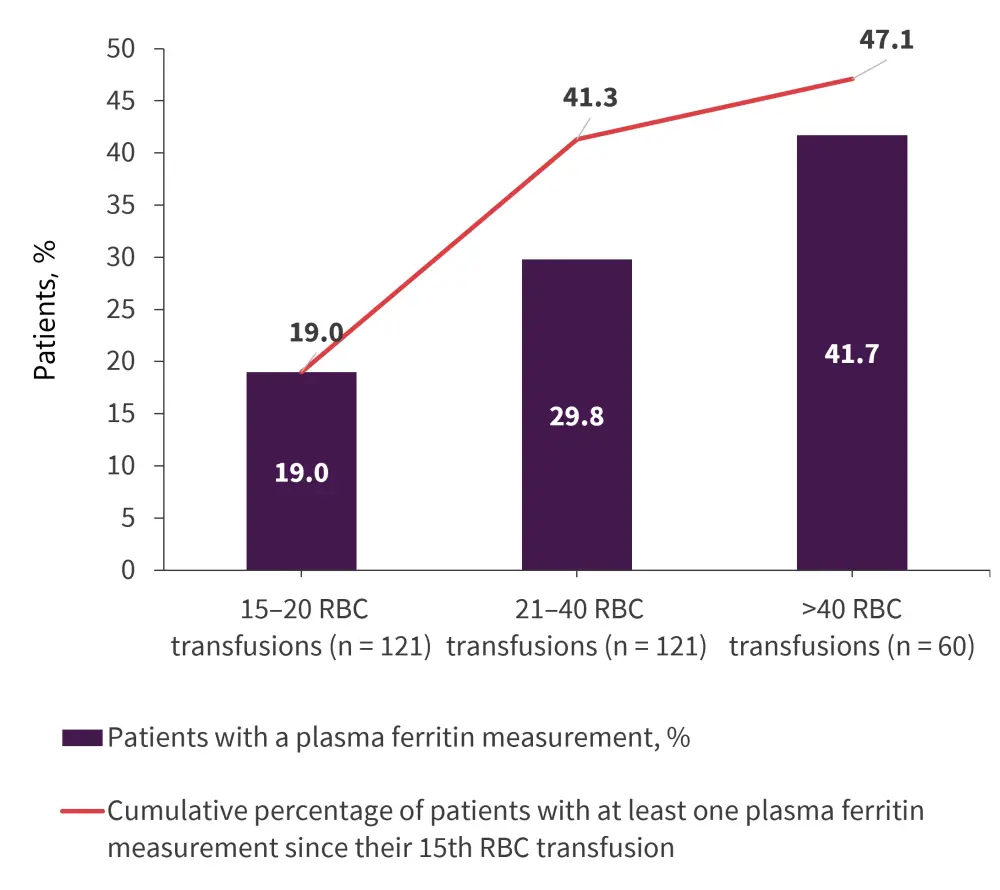
Overall, 121 patients received >20 RBC transfusions. Of these patients, 47.1% had plasma ferritin measurements taken (Figure 2). There was a median of two measurements per patient. Plasma ferritin levels were >1,000 μg/L for 82.5% of patients who had >20 RBC transfusions and plasma ferritin measured.
Figure 2. Plasma ferritin measurements in patients who received >20 transfusions*

RBC, red blood cell.
*Adapted from Rozema, et al.1
Relative risk analysis
The RR analysis showed that, in patients with >20 transfusions, age, CCI scores, and IPSS-R scores did not significantly impact the probability of measuring plasma ferritin levels between the 15th and 25th RBC transfusion. Clinical performance was significantly associated with an increased probability of monitoring plasma ferritin levels between the 15th and 25th RBC transfusion, indicating that ferritin monitoring was primarily based on patients’ clinical performance instead of guideline recommendations. For patients who received >20 RBC transfusions, clinical performance was also significantly associated with an increased probability of monitoring plasma ferritin.
Iron chelation therapy
In this cohort, 47.3% of patients fulfilled the criteria for ICT; however, only 22.3% of these patients initiated ICT. A further 2.1% of the overall population received ICT despite not fulfilling the criteria. Plasma ferritin levels were monitored during ICT in 60% of patients. In 13.3% of the patients who received ICT, plasma ferritin was never measured. Univariate analyses showed no significant difference in gender, hospital type, and CCI score; however age <80 years and lower-risk IPSS-R were significantly associated with an increased probability of initiating ICT. Patients with good clinical performance were more likely to receive ICT than patients with poor clinical performance (Table 2).
Table 2. Relative risks of initiating ICT*
|
CI, confidence interval; IPSS-R, revised International Prognostic Scoring System; ref, reference group; RR, relative risk. |
|||
|
Characteristic |
Patients, % |
RR (95% CI) |
p value |
|---|---|---|---|
|
Hospital type |
|
|
|
|
Medical teaching |
52.3 |
Ref. |
|
|
General |
47.7 |
1.44 (0.73–2.82) |
0.29 |
|
Gender |
|
|
|
|
Female |
30.8 |
Ref. |
|
|
Male |
69.2 |
1.29 (0.52–3.20) |
0.58 |
|
Age at diagnosis, years |
|
|
|
|
>80 |
34.6 |
Ref. |
|
|
≤80 |
65.4 |
2.65 (1.05–6.65) |
0.039 |
|
IPSS-R score |
|
|
|
|
Higher risk |
14.3 |
Ref.† |
|
|
Lower risk |
49.8 |
3.6 (0.90–14.4) |
0.07 |
|
Unknown |
35.9 |
0.60 (0.10–3.43) |
0.57 |
|
Clinical performance |
|
|
|
|
0–1 factor (good) |
42.6 |
Ref. |
|
|
2 factors |
34.6 |
2.22 (0.77–6.36) |
0.14 |
|
3 factors (poor) |
22.8 |
5.99 (2.32–15.45) |
<0.001 |
TSAT measurement – Teichman et al.2
Methods
This prospective observational study included 718 patients with MDS, chronic myelomonocytic leukemia (CMML), and low blast count acute myeloid leukemia (AML) with MDS-related changes registered to the Canadian National MDS registry within 1 year of diagnosis over an 11.5-year period. Mean values of ferritin and TSAT were calculated every 6 months. Median transfusion dose density (TDD) was calculated for patients at Year 1 with low- and high-TDD defined as below or above the median.
Results
Patient characteristics
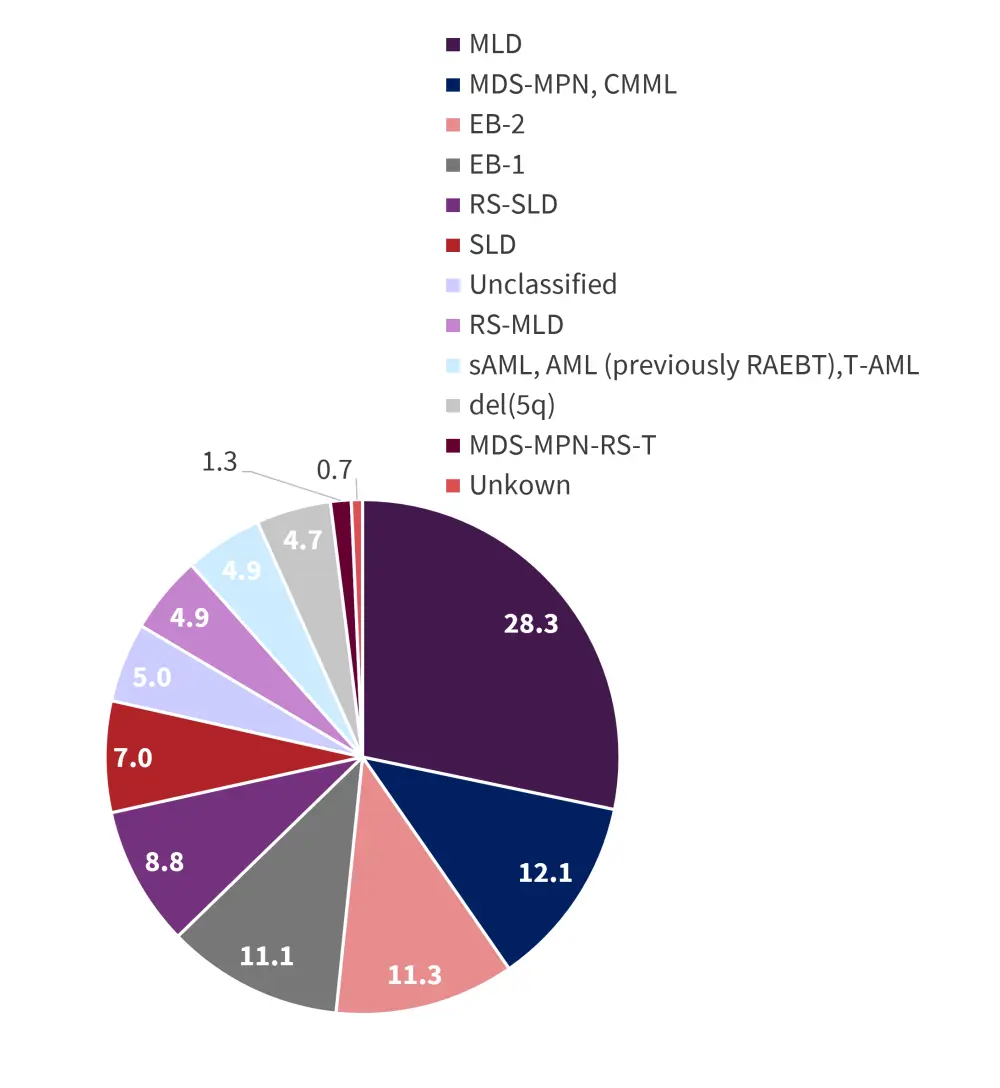
The median age was 74 years. Of the 718 patients, 67% were IPSS-R very low, low, or intermediate (Table 3). Median follow-up time was 2.1 years. Patients were also stratified by MDS subtype (Figure 3).
Table 3. Patient characteristics*
|
ECOG, Eastern Cooperative Oncology Group; ICT, iron chelation therapy; IPSS-R, revised International Prognostic Scoring System; IQR, interquartile range; TSAT, transferrin saturation. |
|
|
Characteristic, % unless otherwise specified |
Patients |
|---|---|
|
Median age, years (IQR) |
74 (67–80) |
|
Sex |
|
|
Male |
63.3 |
|
ECOG performance status |
|
|
0 |
42.1 |
|
1 |
48.0 |
|
2 |
8.7 |
|
3 |
1.1 |
|
4 |
0.1 |
|
Diagnosis type |
|
|
Primary |
91.2 |
|
Transfusion dependent |
30.4 |
|
IPSS-R |
|
|
Very low |
11.3 |
|
Low |
29.2 |
|
Intermediate |
26.7 |
|
High |
14.2 |
|
Very high |
11.7 |
|
Unknown |
6.8 |
|
ICT |
13.2 |
|
Median ferritin at enrollment, μg/L (IQR) |
443.0 (182.0–1,004.0) |
|
Median TSAT at enrollment (IQR) |
43 (28–65) |
|
Median TSAT over time in patients ever on ICT (IQR) |
64 (45–91) |
|
Median TSAT over time in patients never on ICT (IQR) |
41 (27–64) |
Figure 3. Percentage of MDS subtypes*

AML, acute myeloid leukemia; CMML, chronic myelomonocytic leukemia; del(5q), deletion in the long arm of Chromosome 5; EB, excess blasts; MDS, myelodysplastic syndromes; MLD, multilineage dysplasia; MPN, myeloproliferative neoplasms; RAEBT, refractory anemia with excess blasts in transformation; RS, ring sideroblasts; sAML, secondary AML; SLD, single lineage dysplasia; T, thrombocytosis; T-AML, therapy-related AML.
*Data from Teichman, et al.2
TSAT and ferritin levels
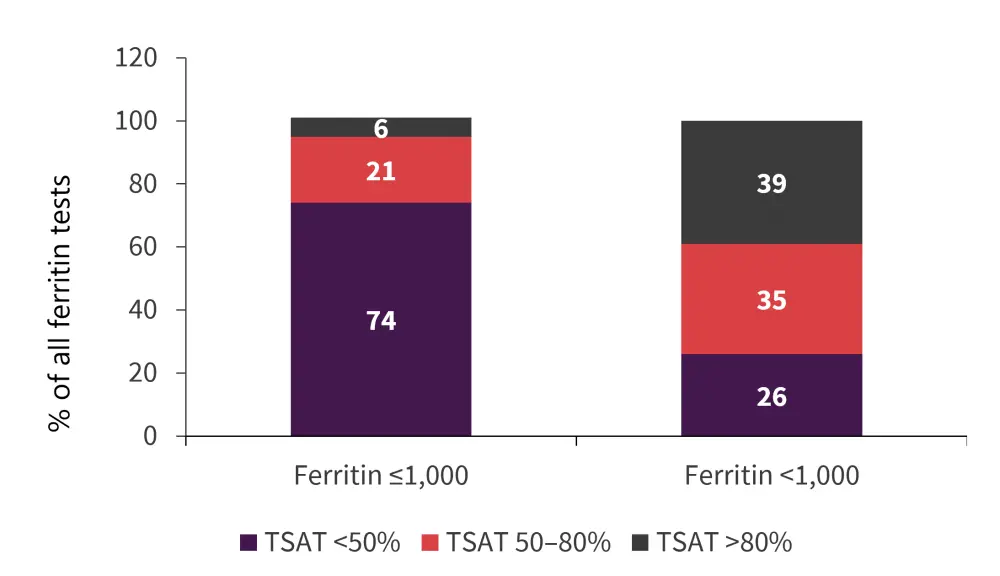
Among all patients, ferritin and TSAT were moderately correlated. Mean TSAT increased with ferritin levels (Figure 4). Ferritin increased in all patients (p < 0.0001), in transfusion-dependent (TD) patients (p < 0.0001) and in transfusion-independent (TI) patients (p < 0.0001) from enrollment to 42 months.
TSAT remained stable over time in all patients (p = 0.094) and TI patients (p = 0.98) but increased in TD patients (p = 0.006) from enrollment to 42 months.
Figure 4. TSAT stratified by ferritin category *

*Data from Teichman, et al.2
Survival outcomes
Higher TDD at Year 1 conferred an inferior overall survival (OS). Higher mean TSAT and ferritin were also associated with inferior OS, progression-free survival (PFS), and leukemia-free survival (LFS). In higher-risk patients, higher TSAT was significantly associated with inferior PFS (p = 0.005) and LFS (p = 0.031), while trending towards a significant association with OS (p = 0.16). In lower-risk patients, higher TSAT was associated with inferior OS (p = 0.003), and ferritin levels were associated with inferior OS (p = 0.003), PFS (p = 0.024), and LFS (p = 0.018). Higher mean TSAT remained significant when stratified by iron chelation therapy.
Deaths related to cardiac events occurred in 52 patients. Mean TSAT >80% was borderline associated with inferior cardiac death-free survival (p = 0.053). When stratified by TD patients, mean TSAT was significantly associated with inferior cardiac death-free survival (p = 0.001) but ferritin was not (p = 0.52). Among the 70 patients who died of infection, ferritin >800 μg/L was significantly associated with the cumulative incidence of infectious death (p = 0.021) while TSAT was not (p = 0.38).
Univariate analysis found age, IPSS-R, blast percentage, Eastern Cooperative Oncology Group (ECOG) performance status, frailty score, CCI, not receiving ICT, TSS, TSAT, and ferritin were significantly associated with inferior OS. Multivariable analysis found TSAT to be an independent predictor of OS.
Conclusion
In the retrospective study by Rozema et al.,1 ferritin levels were measured in <50% of patients with >20 RBC transfusions, and all patients who were eligible for ICT did not receive it. These results suggest that decisions to monitor ferritin were not based on national guidelines. Only clinical performance was associated with ferritin monitoring.
In the prospective study by Teichman et al.,2 the importance of monitoring ferritin and TSAT was highlighted, with TSAT >80% and ferritin >800 μg/L having a significant association with inferior OS, PFS, and LFS. Results from this study indicate that TSAT may be a better indicator of iron overload and oxidative stress than ferritin. Further study is necessary to evaluate the association between TSAT and survival outcomes in patients with MDS.
Iron overload is an important factor to consider for patients with MDS, in particular for patients with a high transfusion burden. Monitoring both ferritin and TSAT can have prognostic significance, indicating the importance of monitoring to detect iron overload and to initiate treatment when necessary.
References
Please indicate your level of agreement with the following statements:
The content was clear and easy to understand
The content addressed the learning objectives
The content was relevant to my practice
I will change my clinical practice as a result of this content

