All content on this site is intended for healthcare professionals only. By acknowledging this message and accessing the information on this website you are confirming that you are a healthcare professional. If you are a patient or carer, please visit the MDS Alliance.
The MDS Hub website uses a third-party service provided by Google that dynamically translates web content. Translations are machine generated, so may not be an exact or complete translation, and the MDS Hub cannot guarantee the accuracy of translated content. The MDS Hub and its employees will not be liable for any direct, indirect, or consequential damages (even if foreseeable) resulting from use of the Google Translate feature. For further support with Google Translate, visit Google Translate Help.


Now you can support HCPs in making informed decisions for their patients
Your contribution helps us continuously deliver expertly curated content to HCPs worldwide. You will also have the opportunity to make a content suggestion for consideration and receive updates on the impact contributions are making to our content.
Find out more
Create an account to access:
Bookmark & personalize site content
Receive alerts for new content in your areas of interest
View MDS content recommended for you
Editorial theme │ Clinical prognosis in MDS
Myelodysplastic syndromes (MDS) are a group of heterogenous disorders, making a single unified prognostic model difficult to implement. In recent years, many prognostic models have been forwarded with varying use globally. As part of our editorial theme ‘Diagnosis and prognosis in MDS’, we summarize the use of different prognostic scoring systems in the clinical setting. These were discussed by Rami Komrokji at the European School of Haematology (ESH) 8th Translational Research Conference: Myelodysplastic Syndromes.1
Risk models
Komrokji1 presented real-world data on several key prognostic scoring systems, highlighting several factors that make an ideal prognostic model (Figure 1).
Figure 1. Key prognostic scoring systems and ideal prognostic characteristics*
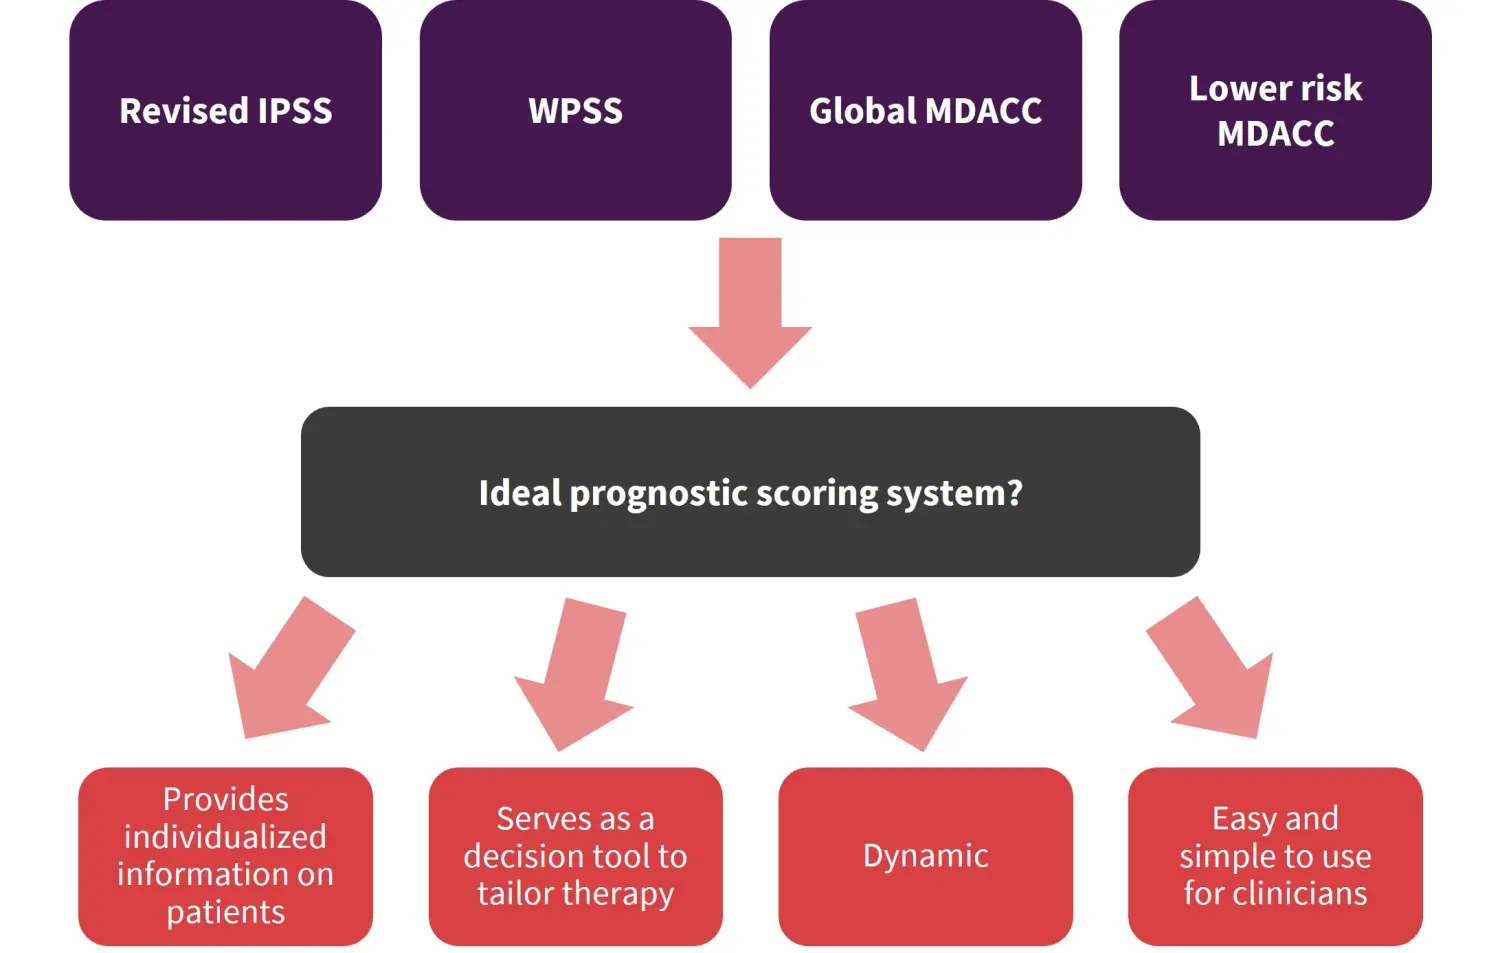
IPSS, International Prognostic Scoring System; MDACC, MD Anderson Cancer Center; WPSS, World Health Organization Classification-Based Prognostic Scoring System.
*Adapted from Komrokji1
Revised International Prognostic Scoring System (IPSS-R)
The IPSS-R incorporates more cytopenia subgroups, further refinement of blast count by splitting the low marrow blast percentage value, and importantly, provides cytogenetic risk stratification. The possible range of summed scores is 0–10 and parameters are summarized in Table 1.
Table 1. IPSS-R scoring system*
|
IPSS-R, Revised International Prognostic Scoring System. |
|||||
|
Parameter |
IPSS-R score |
||||
|---|---|---|---|---|---|
|
Cytogenetic risk |
Very good |
Good |
Intermediate |
Poor |
Very poor |
|
0 |
1 |
2 |
3 |
4 |
|
|
Marrow blasts |
≤2% |
>2% to ≤5% |
5–10% |
>10% |
— |
|
0 |
1 |
2 |
3 |
— |
|
|
Hemoglobin |
≥10 |
8 to <10 |
<8 |
— |
— |
|
0 |
1 |
1.5 |
— |
— |
|
|
Platelet count |
>100 |
50 to <100 |
<50 |
— |
— |
|
0 |
0.5 |
1 |
— |
— |
|
|
Absolute neutrophil count (× 109/L) |
≥0.8 |
<0.8 |
— |
— |
— |
|
0 |
0.5 |
— |
— |
— |
|
Benefits
- Information provided on the cytogenic risk group is much more detailed with the IPSS-R; for example, monosomy 7 is classified worse than del(7q)
- A total of 19 karyotype categories have been identified
- The median overall survival (OS) of patients ranges from 5.9 months with very poor risk to 60.8 months with very good risk
Challenges
- In terms of challenges, the blast percentage for groups of patients with 2–5% compared with <2% bone marrow blasts are hard to obtain through patient records
- An intermediate risk group was created through this model which was a dilemma as it is not certain whether patients in this class are high or low risk
- Score of 3.5 or higher is sometimes used to consider higher risk
- Intermediate risk decision is individualized on factors such as age, molecular profile, and circulating blasts.
Real-world data
- Study data from R-IPSS Moffitt validation confirmed the accuracy of this model with patients in the intermediate risk group achieving superior outcomes with allogeneic hematopoietic stem cell transplantation (allo-HSCT), and early timing was more reasonable for this group.
World Health Organization (WHO) Classification-Based Prognostic Scoring System (WPSS)
- The WPSS integrates karyotype, transfusion modification, and was more recently modified to include anemia and hemoglobin levels (Table 2).
Table 2. WPSS scoring system*
|
RA, refractory anemia; RAEB, refractory anemia with excess blasts; RARS, refractory anemia with ringed sideroblasts; RCMD, refractory cytopenia with multilineage dysplasia; RCMD-RS, refractory cytopenia with multilineage dysplasia and ringed sideroblasts; WHO, World Health Organization. |
||||
|
Parameter |
Score value |
|||
|---|---|---|---|---|
|
0 |
1 |
2 |
3 |
|
|
WHO category |
RA, RARS, del(5q) |
RCMD, RCMD-RS |
RAEB-1 |
RAEB-2 |
|
Karyotype |
Good |
Intermediate |
Poor |
— |
|
Transfusion requirement |
No |
Regular |
— |
— |
Benefits
- This is a dynamic model.
Challenges
- This model is not extensively used in the US, and as classification moves more toward molecular integration, its use will need to be revisited.
Global MD Anderson Cancer Center Model (Global MDACC)
- The Global MDACC factors performance status, age, cytopenias, leukocytosis with myeloproliferative neoplasms (MPN)/MDS, and prior transfusion. When classifying patients to produce four risk categories (Table 3).
Table 3. Global MDACC scoring system*
|
BM, bone marrow; MDACC, MD Anderson Cancer Center; WBC, white blood cell. |
|||
|
Prognostic category |
Score value |
||
|---|---|---|---|
|
1 |
2 |
3 |
|
|
Performance status |
— |
≥2 |
— |
|
Age, years |
60–64 |
≥65 |
— |
|
Platelets, × 109/L |
50–199 |
30–49 |
<30 |
|
Hemoglobin, g/dL |
— |
<12 |
— |
|
BM blasts, % |
5–10 |
11–29 |
— |
|
WBC, × 109/L |
— |
>20 |
— |
|
Cytogenetics |
— |
— |
Chromosome 7 abnormality (≥3 abnormalities) |
|
Prior transfusion |
Yes |
— |
— |
- Patients are divided into four risk categories: Low (risk score of 0–4), intermediate-1 (risk score of 5–6), intermediate-2 (risk score of 7–8), and high (risk score of ≥9)
Benefits
- Patient-related risk factors are informative for prognosis.
Challenges
- Including age should make clinicians think about the staging or tailoring or treatment; for example, when considering allo-HSCT, if someone is classified as intermediate-2 by age alone, this should not be used alone to determine the transplant decision.
- The model is simple but not widely adopted in the US due to the popular use of IPSS.
Lower risk MDACC Model (LR-PSS)
- A prognostic score value is given to divide patients with lower risk MDS into three risk categories (Table 4); risk category 1 (score of 0–2), 2, (score of 3–5), and 3 (score of ≥5).
Table 4. Lower risk MDACC Model (LR-PSS) scoring system*
|
BM, bone marrow; LR PSS, lower risk MDACC Model; MDACC, MD Anderson Cancer Center. |
||
|
Parameter |
LR-PSS score |
|
|---|---|---|
|
1 |
2 |
|
|
Cytogenetics |
Not normal or del(5q) |
— |
|
Hemoglobin, g/dL |
<10 |
— |
|
Platelets, × 109/L |
50–200 |
<50 |
|
BM blasts, % |
≥4 |
— |
Study validation
- Study data among 1,288 lower risk patients with MDS showed that 25% of patients were upstaged from lower risk MDS.
- This model was validated as predictive in both MDS and MDS/MPN.
Choosing the best model
Having a unified model should be the goal for prognosis in MDS; therefore, it is important to compare the prognostic value of these models.
- In a study of 1,140 patients, analyzing the prognostic value of IPSS-R and LR-PSS, the IPSS-R was validated as superior to the IPSS
- However, even with these newer models, it was observed that around 25% of patients had fewer than 2 years OS, and only 37% and 45% using the lower risk and IPSS-R model, respectively, were identified among that group. As such, it is clear the full prognosis is not being captured.
- A second study compared hypomethylating agent (HMA) use in higher-risk MDS (n = 632) among models including IPSS, IPSS-R, French Prognostic Scoring System, MDACC, and WPSS
- All models predicted survival in general, with good accuracy but some of them were not statistically significant.
- None of the models predicted response to HMAs.
- Finally, when comparing the IPSS-R, WPSS, and Global MDACC, it is difficult to identify a superior scoring system with all models distinctly separating outcomes
Applying risk models to therapy-related MDS
- It is uncertain of whether to utilize these scoring models for therapy-related MDS (t-MDS)
- Study data presented compared outcomes of 370 patients with t-MDS with 1,576 patients with de novo MDS.
- IPSS, IPSS-R, Global MDACC, and therapy-related MDACC systems accurately predicted outcomes among patients with t-MDS but inferior outcomes were predicted in t-MDS compared with de novo.
- It is uncertain whether this is due to comorbidities or other malignancies.
Conclusion
Komrakji1 highlighted that all current risk stratification models used in MDS can predict clinical outcomes for patients; however, further personalization is needed owing to the heterogeneity of the disease. This will include dividing patients by those with excess blasts versus without, integrating more genomic and clinical variables, and thinking of patient-related factors.
The new IPSS system, integrating molecular information, is to be introduced to clinical practice soon. However, issues around global access to molecular profiling may mean IPSS-R is still required in certain regions, as detailed in the video below.
Can IPSS-R be used as a prognostic tool in HSCT in regions where molecular analysis is unavailable?
References
Please indicate your level of agreement with the following statements:
The content was clear and easy to understand
The content addressed the learning objectives
The content was relevant to my practice
I will change my clinical practice as a result of this content